Papermaking Chemicals Market: Global Indicators & Trends
Direct Answer: What Is Driving the Papermaking Chemicals Market?
The defensible demand signal is downstream paper production—not an unverified market CAGR. FAO reports 423 million tonnes of paper and paperboard, 241 million tonnes of recovered paper and 189 million tonnes of wood pulp produced globally in 2024. Chemical demand then varies by paper grade, furnish, mill configuration, dosage and performance target.
Evidence reviewed: 20 August 2026.
The global papermaking chemicals market plays a vital role in the efficiency, quality, and sustainability of pulp and paper production worldwide. These essential chemicals, ranging from process aids to functional additives and coatings, influence everything from machine runnability to the final properties of paper and board products. As the industry navigates evolving demands driven by e-commerce, sustainability pressures, and digitalization, understanding the paper chemicals market analysis, current trends, and future forecast is crucial for stakeholders. This article provides an overview of the current market landscape, key driving factors, challenges, and future outlook, offering insights from INVINO, a dedicated supplier of specialty foam control agents to the industry.

Global Papermaking Chemicals Market: Current Size & Overview

No official public dataset provides a single global revenue figure or CAGR for papermaking chemicals. Commercial estimates vary by whether they include commodity fillers, bleaching chemicals, functional additives, coatings and process aids. For an auditable demand baseline, FAO reports that global 2024 production reached 423 million tonnes of paper and paperboard, 241 million tonnes of recovered paper and 189 million tonnes of wood pulp. These are downstream production indicators—not papermaking-chemical revenue.
FAO also reports 2024 paper-and-paperboard production shares of China 33%, the United States 15%, and India, Japan and Germany 5% each. These production shares must not be presented as regional shares of the chemicals market.
Key Market Segments by Chemical Type
The papermaking chemicals market is broadly categorized into:
- Functional Chemicals These chemicals impart specific properties to the final paper product. Key types include sizing agents (for water resistance), dry strength additives, wet strength resins, fillers (e.g., PCC, GCC), optical brightening agents (OBAs), and dyes/pigments. Market growth in this segment is often linked to demands for specialized paper grades.
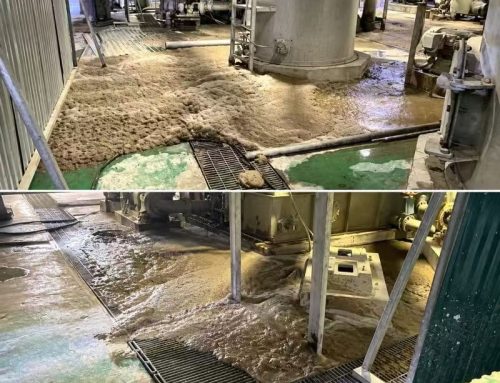
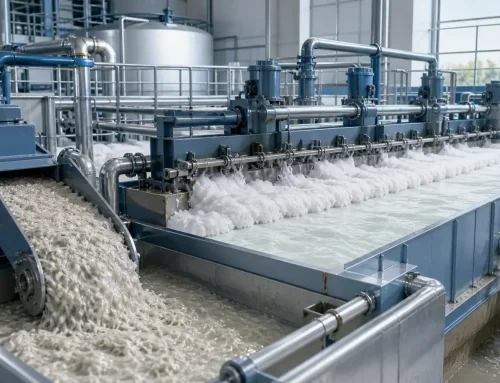
- Process Chemicals Used to optimize the pulp and papermaking process itself. This diverse category includes pulping chemicals, bleaching agents, retention and drainage aids, biocides, and crucial foam control agents like defoamers and antifoams. The antifoam agent market within process chemicals is vital for maintaining machine efficiency and product quality. INVINO specializes in high-efficiency industrial antifoams for these applications.
- Coating Chemicals Applied to the paper surface to enhance printability, gloss, smoothness, and barrier properties. This includes binders (e.g., latex, starch), pigments (e.g., kaolin, calcium carbonate), and various additives.
Major Market Trends & Drivers Shaping the Industry
- (H3): Sustainability and Environmental Regulations Increasing pressure exists to adopt greener chemistries. This drives demand for biodegradable products, chemicals enabling water and energy reduction, formaldehyde-free resins, and antifoams for ecolabel compliance. Closed-loop water systems also present unique challenges for chemical management.
- E-commerce and Packaging Demand E-commerce and packaging formats influence demand for containerboard, corrugated boxes and related strength, sizing and coating chemicals. The effect should be assessed using current grade-level production and mill consumption data.
- (H3): Decline in Graphic Papers Digitalization continues to impact the demand for printing and writing papers, affecting the market for chemicals specific to these grades (e.g., certain fillers, OBAs).
- (H3): Raw Material Costs & Supply Chain Volatility Fluctuations in petrochemical feedstock prices, energy costs, and ongoing global supply chain disruptions impact chemical pricing and availability. Reliability from chemical suppliers paper industry relies upon is key.
- (H3): Technological Innovation Development of novel chemical additives, nanotechnology applications, and bio-based chemicals offers new opportunities for performance enhancement and sustainability.
Market Challenges
Key challenges facing the papermaking chemicals market include navigating stringent environmental regulations, managing volatile raw material costs, intense competition among suppliers, and the need for continuous innovation to meet evolving paper grade requirements.
Evidence-Based Papermaking Chemicals Outlook: 2026–2030
Future chemical demand should be evaluated through measurable operating drivers rather than an unsupported fixed CAGR. The most useful indicators are paper and board output by grade, recovered-fibre use, mill capacity utilization, water and energy constraints, packaging regulation, and verified changes in chemical dosage per tonne.
| Audited downstream indicator (2024) | FAO value | Change vs. 2023 | How to interpret it |
|---|---|---|---|
| Paper and paperboard production | 423 million tonnes | +4% | Broad output baseline; not chemical-market revenue |
| Recovered paper production | 241 million tonnes | +1% | Relevant to furnish variability and process-aid demand |
| Wood pulp production | 189 million tonnes | +3% | Relevant to pulping and bleaching process demand |
Procurement implication: Forecast chemical consumption mill by mill using tonnes produced × validated dosage range, then adjust for furnish, grade, machine speed, water closure and quality targets. Do not convert paper-production share directly into chemical-market share.
INVINO’s Role in the Paper Chemicals Market
As a focused and reliable supplier, INVINO plays a key role in the papermaking chemicals ecosystem, particularly in providing advanced foam control agents. We are committed to:
- Delivering high-performance industrial antifoams that enhance efficiency and quality in pulping and papermaking.
- Offering technical expertise to help customers select and optimize defoamer usage.
- Developing solutions that align with industry trends towards sustainability and efficiency.
Paper-chemical demand changes with grade mix, fibre source, production volume, water closure and mill performance targets. Suppliers should support claims with product documentation and application trials. INVINO provides application-specific foam-control support for paper production.
Evidence note: audited public production indicators were reviewed on 20 August 2026. Commercial revenue estimates are excluded unless their scope and methodology can be independently checked.
Evidence Sources & Method
- FAO Forest Product Statistics — annual production, trade, recovered-paper and pulp-and-paper capacity data.
- EUR-Lex: Regulation (EU) 2025/40 on packaging and packaging waste — regulatory context for packaging circularity.
Method: Values on this page are labelled by dataset, year, unit and meaning. Paper output and country production shares are treated as downstream indicators; they are not relabelled as papermaking-chemical revenue or regional chemical-market share.
Papermaking Chemicals Market Data FAQ
These answers separate official forest-product indicators from commercial chemical-market estimates so the page can be cited without relabelling production data as chemical revenue.
Q: Does 423 million tonnes represent the size of the papermaking chemicals market?
A: No. It is FAO's reported 2024 global production of paper and paperboard. It is a downstream production indicator, not chemical-market revenue, chemical volume or a regional market share.
Q: Is there an official global CAGR for papermaking chemicals?
A: No single official public dataset defines a global papermaking-chemicals revenue total or CAGR. Commercial estimates use different scopes, such as fillers, bleaching chemicals, coatings, functional additives and process aids, so figures should not be combined without checking methodology.
Q: What is the latest evidence year used on this page?
A: This page uses FAO's 2024 forest-products production and trade data, published in December 2025 and rechecked on 20 August 2026. The page labels the dataset year separately from the review date.
Q: Why is recovered-paper production relevant to chemical demand?
A: Recovered-paper volume is a downstream furnish indicator. Changes in recycled-fibre use can alter dissolved and colloidal substances, contaminants, retention, drainage and foam-control needs, but the 241 million-tonne FAO figure is not itself a chemical-demand forecast.
Q: Which indicators should a paper-chemical buyer track?
A: Track paper and board output by grade, furnish mix, recovered-fibre use, mill utilization, water-system closure, energy and water constraints, verified dosage per tonne, regulation and measured process performance. These indicators are more auditable than an unsupported headline CAGR.